
It’s that time of year — the new National Inventory Report numbers are out, detailing Canada’s greenhouse gas (GHG) emissions from 1990 up until the end of 2018. The annual data from across all sectors of the economy, from all provinces and territories, takes over a year to collect and collate, which is why we’re just now seeing the numbers for 2018. What do they tell us? We are going in the wrong direction: instead of going down, Canada’s emissions increased overall by two per cent from 2017 to 2018.
These numbers tell us the task ahead will be even harder than we thought. We can take some comfort, however, in the knowledge that this is the last year emissions data won’t reflect the implementation of major elements in Canada’s national climate plan, the Pan-Canadian Framework on Clean Growth and Climate Change. Key pillars of the plan — including the national price on pollution, the national phase-out of electricity generation from coal (following early provincial action from Ontario and Alberta), and regulations to reduce methane emissions in the oil and gas sector — started coming into effect in 2019.
The COVID-19 pandemic is pausing the global economy and, likely, emissions. The National Inventory Report carbon emissions numbers serve as a stark reminder of the need to prioritize post-pandemic economic rebuilding efforts around measures and investments that will help decarbonize our economy and allow us to emerge with greater resilience. The data shows now is not the time to dial back climate action. As of the end of 2018, Canada had only achieved 0.4 per cent of the progress needed to hit our current 2030 target (to reduce national emissions 30 per cent below the 2005 level) — a target that will be up for revision this year as countries worldwide increase their ambition in accordance with the five-year “ratcheting” cycle established under the Paris Agreement. While we can anticipate a temporary drop in emissions as a result of the pandemic response, this is a reduction that no one will celebrate, given both its extreme socio-economic cost and the fact that what matters, from the climatic point of view, is the cumulative atmospheric concentration of heat-trapping gases — not temporary and unplanned emission reductions that are clearly unsustainable. Going forward, Canada will need to reduce greenhouse gas emissions by nearly 22 million tonnes (MT) each year — the equivalent of taking 4.8 million cars off the road — to meet its 2030 objective, and be on track to reach net-zero emissions by 2050.
These are hard numbers to swallow, but there are many reasons to remain hopeful. The Intergovernmental Panel on Climate Change report on limiting warming to 1.5 degrees reminds us that a safer climate is within reach by means of currently existing technologies; we just have to work together to make it happen.

And in the past few weeks, Canadians have demonstrated the power of collective action. They have come together — while remaining physically apart — to show support for healthcare and frontline workers, and to flatten the curve. Provincial and federal leaders have put politics aside for the betterment of Canadians.
This spirit of collective action is essential to combat the other global crisis of climate change. We’re seeing that spirit made manifest through the COVID-19 stimulus measures, which are already serving the dual functions of kickstarting the low-carbon economy and providing jobs, as witnessed by the historic investment in orphan well clean-up and methane emissions reductions. The Pembina Institute has made a series of other green stimulus recommendations for sectors across Canada, including in transportation, buildings, and electricity, to ensure that our efforts to solve this global crisis don’t inadvertently exacerbate another.

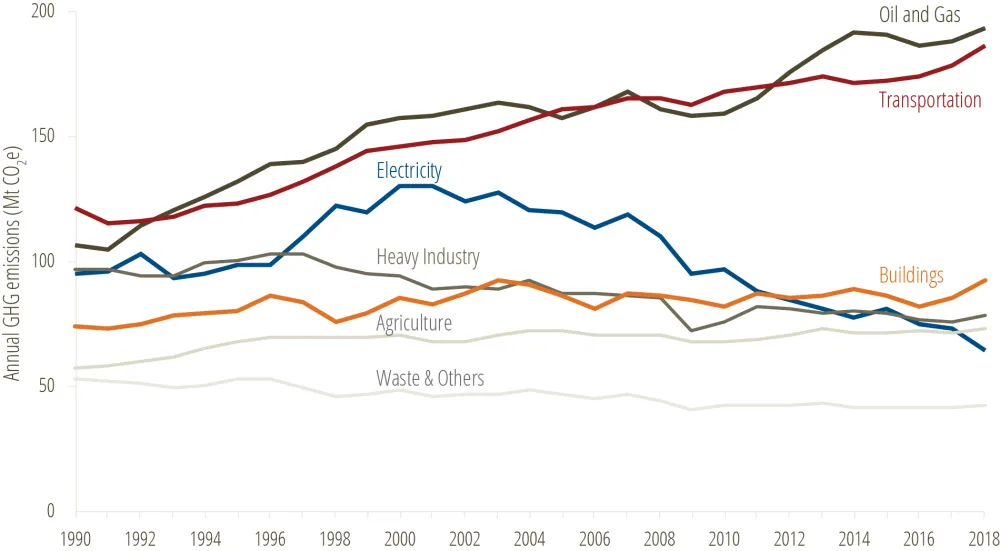
Here in Canada, carbon emissions increased in all areas of the economy in 2018 — except electricity. With a consistent downward trend in emissions since the early 2000s, electricity is definitely the star sector. Its progress is attributable mainly to the national coal phase-out, led by Ontario and Alberta, and the fast-declining cost of renewables. As demonstrated in our report, renewable energy as part of a clean energy portfolio is now just as reliable as natural gas, and more cost-effective — even in peak demand scenarios in Alberta, where natural gas prices are particularly low.

Carbon emissions from the buildings sector grew, and also saw the highest rate of increase (8 per cent over 2017-18) across all sectors — twice the growth seen in transportation and three times that in oil and gas over the same period. According to Environment and Climate Change Canada, this was due primarily to colder winter weather, which boosts heating demand and thus emissions from fuels, like natural gas, that commonly serve this energy need. Investing in deep retrofits for existing buildings to reduce their fossil fuel reliance and dramatically improve their energy efficiency can make a meaningful dent in the emissions from our homes, places of business, and other commercial and institutional buildings.
While emissions from buildings jumped in 2018, the highest-emitting sectors are still transportation and oil and gas, at 25 and 26 per cent, respectively. In transportation, efforts to switch to zero-emission vehicles and reduce demand are not moving the dial quickly enough. We need to shift into high gear. Decarbonizing the transportation sector will be difficult, but will bring a host of benefits, including cleaner air and job growth. Our electric vehicle transition report shows a massive opportunity for Canada to pivot its once-formidable auto-manufacturing sector to focus on electric vehicle production for both passenger and freight vehicles.
Oil and gas emissions reached a record high in 2018. Most of the carbon emissions growth in the sector in 2018 was driven by the oilsands, where increases in in-situ production and upgrading continue to outpace gains achieved via lower per-barrel emissions intensities. Essentially, the data indicates that when it comes to emissions, technological gains haven’t done enough to keep up with growth in production. (Our oilsands report, published earlier this year, documents the growing gap between rising oilsands emissions and Canada’s climate commitments.)

Provincially, the usual distribution of emissions continues, with Alberta and Ontario responsible for the lion’s share of Canada’s GHGs (a combined total of 60 per cent). While emissions in Alberta held steady, Ontario saw a six per cent uptick in emissions from 2017 to 2018, largely due to growth in the buildings and transportation sectors (where, it is also worth noting, the carbon pricing signal from Ontario’s cap-and-trade system ceased to apply).
There’s no sugarcoating the story this data tells. The decarbonization of Canada has a long way to go. But, as the country works to rebuild its economy in the wake of the COVID-19 pandemic, we are certain there are synergies to be found in action for a safer climate. We’re inspired by how communities, provinces, and the federal government are heeding scientific advice and working together to tackle this global health crisis. We are confident this spirit of collective action can extend to the climate crisis, too.