Climate policy can sometimes seem bewildering in its complexity. But, in many ways, it all comes down to simple math. Crunching numbers is our great love here at the Pembina Institute, so the release of the National Inventory Report (NIR) is one of our favourite days of the year.
The NIR is an annual — and impressively thorough — government report accounting for Canada’s greenhouse gas (GHG) sources and sinks. It’s critical to Canada’s ability to track its climate progress, as each iteration reveals emissions trends by province and territory, by economic sector, and by the formal categories mandated by our participation in the U.N. Framework Convention on Climate Change (UNFCCC). By providing a quantitative picture of Canada’s GHG inventory, it shows us how close we are to achieving our climate goals, and how much more we need to do. Note that a two-year delay for data processing is standard, so this year’s NIR covers the period from 1990 to 2015.
Tracking emissions is especially important, given our commitment to upholding the UNFCCC Paris Agreement. As established within the Agreement, the nations of the world (or at least, the Agreement’s 195 signatories) have a global temperature target: keeping average surface temperature rise to below 2°C, with a further aspiration to keep within 1.5°C. To avoid overshooting the mark, countries party to the Agreement have established individual emissions targets, and have committed to implement plans to reduce emissions, continually measure progress, and increase ambition over time.
It’s well known that Canada’s target commits the country to reducing its emissions 30% below 2005 levels by 2030. But what does “30 by 2030” really mean, and how are Canada’s efforts going? Here are three key trends from the 2017 data:
Story #1: National emissions are falling slowly…but we’re still not on track
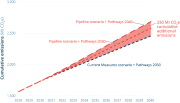
Nationally, GHG emissions in 2015 fell 5 Mt from the previous year. This continues Canada’s short-term downward trend after emissions peaked in 2013. However, the rate of decline is far from ideal: at 5 Mt per year, it would take until 2056 to meet our 2030 target. Obviously, the pace of decarbonization must increase if we are to achieve our Paris goals.
 and projected. Note: 2BR is Canada’s Second Biennial Report on Climate Change (2015). 2BR projected the national emissions trend based on current policy in summer 2016. At the end of the year, the 2016 GHG emissions Reference Case updated the projections from 2BR by including all policies announced up to Nov. 1, 2016.")
The government’s most recent “Reference Case” projections suggest that Canada still has its work cut out for it. Canada’s emissions are expected to rise to 731 Mt in 2020, and to 742 Mt in 2030. If the projections play out, they will not only take us further away from our 2030 target, they will make it very unlikely we achieve our long-term aim to have an economy that is decarbonized by mid-century.
An important caveat to this forecast is that ECCC’s projections do not currently include all measures announced under the Pan-Canadian Framework on Clean Growth and Climate Change, announced at the end of fall 2016. Major policies like the clean fuel standard, federal coal phase-out, and other measures for transportation, industry, and buildings, are not yet included in the modelling of future emissions.
Story #2: The window for western leadership is (wide) open
As the bar graph below shows, solid mitigation efforts in Atlantic and Eastern Canada contrast with increasing emissions in the Prairie provinces. Expansion of the oilsands drove 18% growth in emissions from Alberta since 2005, while Ontario’s carbon footprint shrank by 19%, surpassing the Copenhagen target ahead of schedule. In sum, Canada’s emissions have fallen 2.2% since 2005 — a net decrease of 16 Mt.
.")
Meanwhile, in terms of provincial contributions to the national total, Canada’s highest-emitting provinces maintain their positions relative to one another.
.")
However, it’s worth remembering that while the charts above depict a (slightly delayed) snapshot of current affairs—they capture the results of provincial climate efforts to 2015 — they don’t account for the ongoing dynamics at play in each region. For example, Saskatchewan’s 50% renewable capacity standard for electricity is expected to depress its GHGs out to 2030 (along with incoming federal regulations to phase out coal-fired power). So it's likely to move left (the right direction!) on the chart showing change since 2005. By contrast, British Columbia's policy progress has stalled and its emissions, static in recent years, are projected to grow some 39% by 2030 — in seeming defiance of our national target and our low-carbon ambitions under the Pan-Canadian Framework (PCF).
Story #3: Sectoral successes — and setbacks
Here’s the breakdown of emissions in 2015 by economic sector:
.")
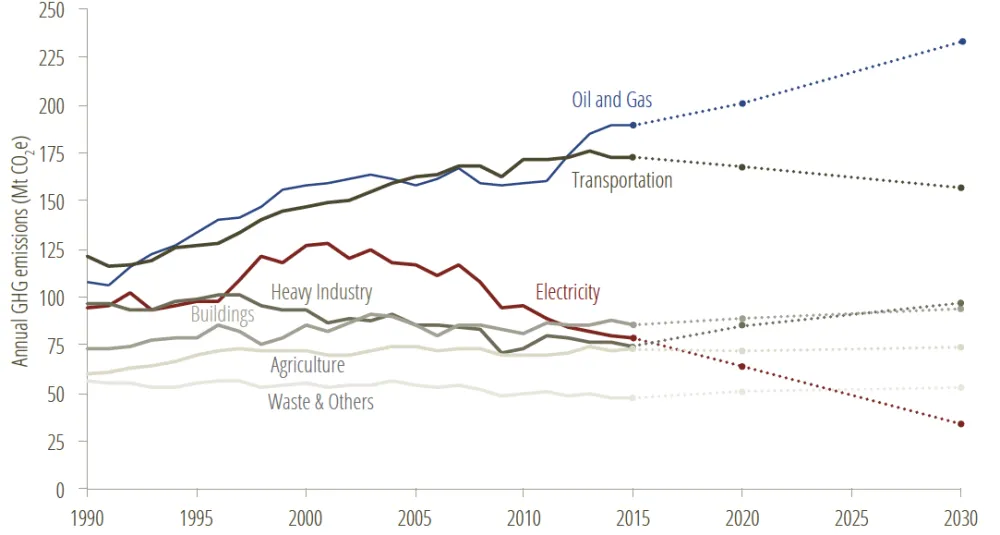
And here’s how the sector trends have evolved over time, with the government’s projections for change out to 2030:
 [all data points 1990-2015]. Projected data (dotted lines) from Canada’s 2016 GHG emissions Reference Case.")
The big success story in Canada’s mitigation efforts to date is in the electricity sector (see red line above). Building on the momentum established in Ontario, which completed its phase-out of coal-fired power in 2014, carbon pollution from this sector continues to decline rapidly. This trend is expected to continue in light of big policy moves by Alberta and the federal government to phase-out coal-fired power by 2030. However, conversions to natural gas have the potential to stymie GHG reductions in later years.
While the national coal phase-out is welcome, long-overdue news, it does raise the concern of gas lock-in. The more we rely on natural gas to replace lost generation capacity—either through the construction of new plants or the conversion of old coal units—the harder it will be to reduce the pollution profile of our electricity system in the long term. This, in turn, will affect the ability of other sectors like transportation to decarbonize. As the government develops its revised regulations for coal-fired power and new natural gas plants, we will be watching to ensure that the projected electricity emissions reductions actually happen. This means replacing coal-fired power with clean energy — not rushing to natural gas.
While the electricity sector is making significant headway towards a decarbonized economy, the bad news is that this success is entirely undercut by another sector: oil and gas (see blue line). The sector overtook transportation in 2012 to become the highest-emitting source of national emissions. Total output of bitumen and synthetic crude oil from Canada’s oil sands operations has increased 140% since 2005, contributing 37 Mt of additional emissions from mining and upstream oil and gas production. This has effectively erased the 38 Mt decrease in emissions that Ontario’s coal plant closures would have had on Canada’s emissions inventory.
All in all, Canada is making some progress – but policymakers need to keep their eyes on the long-term goal of decarbonization. We look forward to swift implementation of all policies within the PCF, and to future rounds of modelling that demonstrate continued progress towards our climate targets.