When talking about transit investment, a wise friend keeps advising me to “sell the beach, not the flight.” In other words, stop debating revenue tools, and instead show where this investment will take us: a city with reduced congestion, more jobs, shorter commutes, saved money and more ways to get around.
Last week the premier’s advisory panel on transit investment proposed a strategy to raise funds for transit expansion while minimizing the burden on taxpayers. The panel’s strategy includes a gas tax, which became a lightning rod in the subsequent discussion.
As I explained in last week’s blog, a five-cents-per-litre gas tax will cost the average driver $96 per year. That’s a pretty cheap flight to transit paradise.
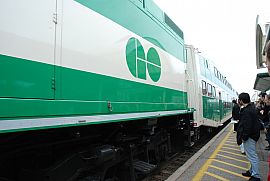
When we land on the “beach” of expanded transit, 80 per cent of people in the region will live within two kilometres of rapid transit (twice as many as today). They’ll have easy access to a network that stretches from Oshawa to Hamilton, including subways, light rail, separated rapid busways and improved GO trains.
Save more than you pay
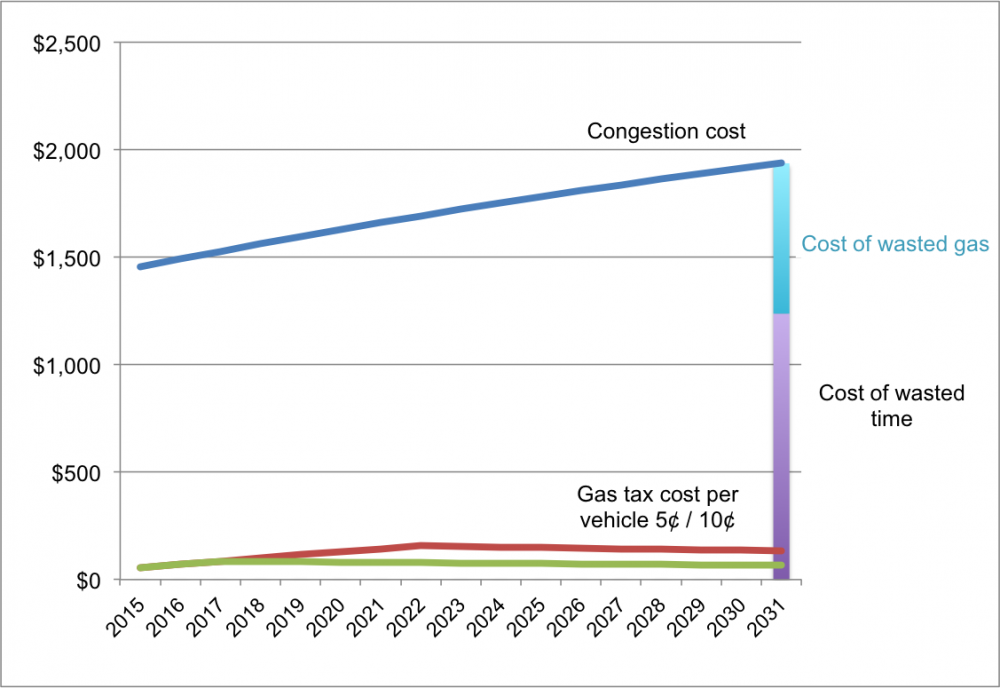
The graph below illustrates that the cost of inaction — that is, not investing in transit — is far greater for every commuter than the cost of these revenue tools. If we fail to act, our traffic problems will only worsen. As the blue line on the graph shows, the annual cost of congestion will continue to rise.

These are very real costs. A large share of this total — approximately $700 per year — is the cost of extra gas burned by drivers. Without the Big Move, daily commute times in the Greater Toronto and Hamilton Area will increase from the current average of 77 minutes to a whopping 109. For drivers, much of that time will be spent idling in traffic.
Time is money
While the cost of wasted gas is borne by those who drive, all commuters pay for those extra 32 minutes. The cost of lost wages and productivity due to that extra time in traffic works out works out to more than $800 per commuter, represented by the purple bar in the graph above. And that’s an extremely conservative estimate based on an average wage of about $22 per hour, and assuming that only a modest proportion of one’s commuting time is “lost.”
A gas tax of less than $100 per year directed to transit expansion will save the average commuter between $800 and $1,500 in lost time and wasted fuel.
All tallied, the annual cost of inaction is in the neighbourhood of $1,500 per driver and at least $800 per transit rider (not including the increases in transit fares), compared to less than $100 for a five-cent gas tax. The “beach” of a comprehensive transit network is looking more and more appealing.
The trend lines in the graph above are also telling: the cost of congestion increases steadily over time, while the yearly costs of a gas tax actually decrease.
This occurs because of federal regulations that mandate increased fuel efficiency for new vehicles. As vehicle stock turns over, the efficiency of the average vehicle on the road will increase. Thanks to these gains in efficiency, by 2025 the annual cost to drivers will drop to $74 with a five-cent gas tax, or $149 with a 10-cent tax.
Providing choices for commuters
Expanding transit also helps to change people’s commuting habits. When the next wave of Big Move projects is completed, one million more people in the region will live within a 10-minute walk of rapid transit.
That means more households will have the option of shedding at least one car, along with the $11,000 of yearly expenses that come with it. Those who keep their cars could actually save money with the gas tax by taking transit instead of parking downtown just five times in a year.
The panel’s revenue tools were chosen in part to support this goal. Gas taxes, highway tolls and parking levies not only raise money, but they also influence driver behaviour. They both collect the funds for transit expansion and encourage drivers to a shift travel modes and take advantage of the expanded transit system.
 The gas tax is easier, faster and less costly to administer than the others, which is one reason the panel recommended it. It also covers diesel fuel for trucks, so both individuals and businesses contribute their fair share.
To offset the increased cost of gasoline, the panel suggests the province consider usage-based (pay-as-you-drive) auto insurance. This measure gives drivers more control over their insurance costs, as they can reduce rates by driving less. Cutting these costs frees up some of their transportation budget for other options such as transit passes or a bicycle.
Finally, individual drivers can also choose more fuel-efficient vehicles to further offset the costs of the tax. The annual cost of fuelling a passenger vehicle ranges from $1,400 for a Honda Civic all the way to $4,000 for a Chevrolet Suburban. The potential for individual savings from a more efficient vehicle is tremendous.
Pay for what you burn, not what you earn
Ideally, the activities we want to encourage — working income, for example — should be taxed less than activities with negative consequences for society. There’s a reason we tax cigarettes more than groceries.
A gas tax is a close cousin to carbon pricing, which means it can improve air quality and help Ontario meet our greenhouse gas reduction targets. That also means that we can look at other jurisdictions’ experiences to understand the impact of this proposal.
British Columbia introduced a carbon tax in 2008. The province currently taxes greenhouse gases from fuel combustion at a rate of $30 per tonne, which equates to seven cents per litre of gasoline. Their tax was phased in with annual increases equivalent to 1.1 cents per litre, making the process similar to Ontario’s proposed gas tax.
The result? A recent study of the B.C. tax’s first five years found significant reductions in per-capita fuel demand with no discernible reduction in economic growth. Another analysis found that B.C.’s tax was highly effective at reducing demand: a five-cents-per-litre increase in fuel prices from the tax resulted in a 10.6 per cent reduction in short-run gasoline demand.
Ontario has also committed to aligning its climate policy with our partners in the Western Climate Initiative, namely Quebec and California. Increasing Ontario’s gas tax by five or 10 cents per litre of gasoline is equivalent to a price of $22 or $44 per tonne of CO2, respectively. With the gas tax, Ontario will be better positioned to reap the benefits of a linked emissions trading system.
Investing in transit expansion
The panel has put two proposals on the table. Both of them add five cents per litre to the province’s gas tax by 2017. After that happens, there are two options: either continue gradually increasing the tax to 10 cents per litre, or stop at five and collect the additional revenue using a small harmonized sales tax increase.
 The costs are distributed more broadly among the population in the second option, because it uses the HST, but both proposals add up to roughly the same yearly household cost. Of course, revenue options other than the HST could be considered to supplement the five-cent gas tax.
In either case, the benefits of a regional transit network far exceed the cost of the gas tax. As is shown in our graph, even if the gas tax were to reach 10 cents per litre, the cost of inaction for drivers is still three times as much.
It’s critical that we understand transit expansion as an investment, and not just a cost. Transit is a public asset that we all share, and one that will provide enormous benefits now and for future generations. There’s more than one way to reach our transit destination, but we’ll never see the beach if we don’t get on the flight.
Special thanks to P.J. Partington for his assistance with research and analysis.
Click here for data sources
The annual cost of gas tax per average vehicle estimate is based on 2011 CO2 emissions and vehicle population data from Environment Canada and represents the average volume of gasoline consumed per light-duty vehicle (weighted average of cars and light trucks) in Canada in 2011. Environment Canada, National Inventory Report 1990-2011: Greenhouse Gas Sources and Sinks in Canada (Gatineau, QC: Government of Canada, 2013).
Average fuel consumption is assumed to decline over time as a result of stock turnover and federal regulations requiring improvements in vehicle efficiency. Costs include 13% HST. Note that the panel recommends that revenue from gas tax HST be directed to transportation investment.
Cost of congestion estimate based on Metrolinx’s commuter cost estimates ($3.3bn rising to $7.8bn by 2031) and regional population estimates (6.1m rising to 8.6m by 2031) for the GTHA, assuming both grow linearly: Metrolinx, The Big Move: Transforming Transportation in the Greater Toronto and Hamilton Area (Toronto, ON: Government of Ontario, 2008).
The ratio of commuters to total population for the GTHA is based on Statistics Canada’s 2011 National Household Survey for the Toronto Census Municipal Area, and is assumed to remain fixed over time. Statistics Canada, National Household Survey Profile, Toronto CMA, 2011.
Cost of wasted gas ($700/ year/ commuter) estimated by the transit panel based on 32 minutes’ additional daily commuting time; 60 km/hr travel speed; 10L/100 km fuel efficiency; 5 days’ commuting per week; $1.25 per litre of gasoline; and 80% additional fuel spent in congested traffic. (Kesting A, Treiber M, “Calibrating car-following models using trajectory data: A methodological study”, Transportation Research Board, Record: 2088: 148-156). Average daily commute times increased by more than half an hour — from an estimated 77 to 109 minutes — a cost of $16.00 per week.
Cost of wasted time and wages estimated using time valuations by transport mode from Victoria Transport Policy Institute, Transportation Cost and Benefit Analysis II – Travel Costs (2013), Table 5.2.11-1, applied to mean wage and commuter data for the Toronto Census Metropolitan Area from Statistics Canada's National Household Survey 2011.
The U.S. Energy Information Administration's Annual Energy Outlook 2014 projects a 2% annual improvement in the fuel economy of the U.S. light-duty vehicle stock from 2012 through 2040. While Canada's vehicle stock has a different starting point, our fuel economy regulations are closely aligned with the U.S., making a similar 2% per year improvement in the Canadian light-duty stock a reasonable assumption. This rate has been reduced by 10% to account for increased driving due to improved fuel economy ("rebound effect"), following Environment Canada practice in Regulatory Impact Analysis Statements.


