It’s one of spring’s finest traditions, at least for climate policy wonks like us: every year, industrialized countries publish their national inventories of carbon pollution. Canada’s vast and detailed report, meticulously assembled by Environment Canada, gives us a thorough picture of where our greenhouse gas (GHG) emissions come from, and how they have changed since 1990.
(In another fine Ottawa tradition, the report was quietly published on a Friday afternoon, but the media found it anyway.)
Last year we explored three key stories in the 2013 inventory report. This year, we’ll check back in to see how they have changed.
Story #1: Canada’s emissions trends
In 2011, overall greenhouse gas emissions rose slightly. In 2012, they fell slightly, back to where they were in 2010. This is good news, since Canada’s emissions were expected to rise again. Most of the difference can be attributed to milder weather reducing demand for heating, but promising signs are also starting to emerge in sectors like transportation and manufacturing.
Although it’s always heartening to see movement in the right direction, it’s going to take a lot more than the 0.3 per cent reduction experienced in 2012 for Canada to fulfill our international commitments. If we kept reducing emissions at that rate every year, we wouldn’t reach our 2020 target until 2057.
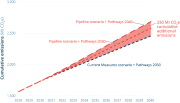
But that kind of sluggish progress isn’t what federal analysts foresee for Canada. Instead, Environment Canada projects something worse: that Canada’s emissions will rise to 2020 and beyond. That moves us farther away from our international commitments, rather than closer. Under the government’s most recent projections, Canada is expected to miss our 2020 target by 122 tonnes — more than the emissions of Atlantic Canada and British Columbia put together.
The United States, which has the same 2020 target as Canada, reduced its emissions by 3.4 per cent in 2012. That puts their emissions at 10 per cent below the 2005 level — the lowest they have been in 20 years.
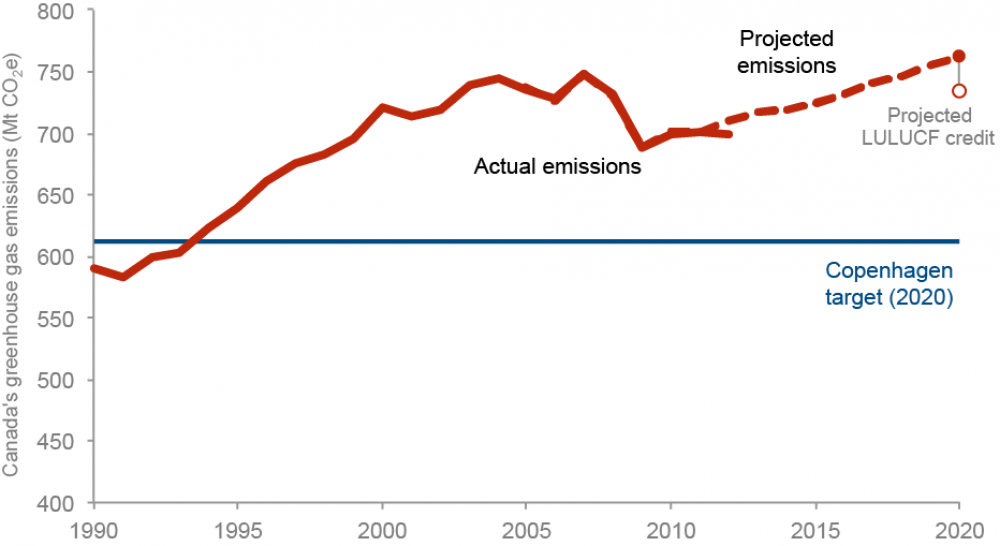
Canada’s historic and projected GHG emissions. Historic data from Environment Canada, National Inventory Report 2014. Projected data from Canada’s Emissions Trends 2013. Note: Environment Canada is projecting an estimated 28 Mt credit from the Land-use, Land-use Change and Forestry (LULUCF) sector. Accounting for this credit places Canada’s projected 2020 emissions at 734 Mt, or 0.2 per cent below the 2005 level.
Story #2: Provincial policies are having a clear impact
As we saw last year, electricity emissions are continuing to decline as highly polluting fuels like coal account for less of Canada’s overall electricity generation. Meanwhile, efficiency measures are moderating our electricity demand.
Ontario’s coal phase-out has had the largest impact by far here. The carbon intensity of Ontario’s electricity generation has fallen by 56 per cent since 2005, with emissions falling the same amount. But actions in other provinces to use cleaner power and cut energy waste are producing results too. Overall, Canada’s power sector has improved its carbon intensity by nearly 30 per cent since 2005.
Transportation emissions are steady or declining in a number of provinces as well, with B.C. and Ontario — two provinces that have worked hard on the transportation sector — experiencing the most significant reductions since 2005.
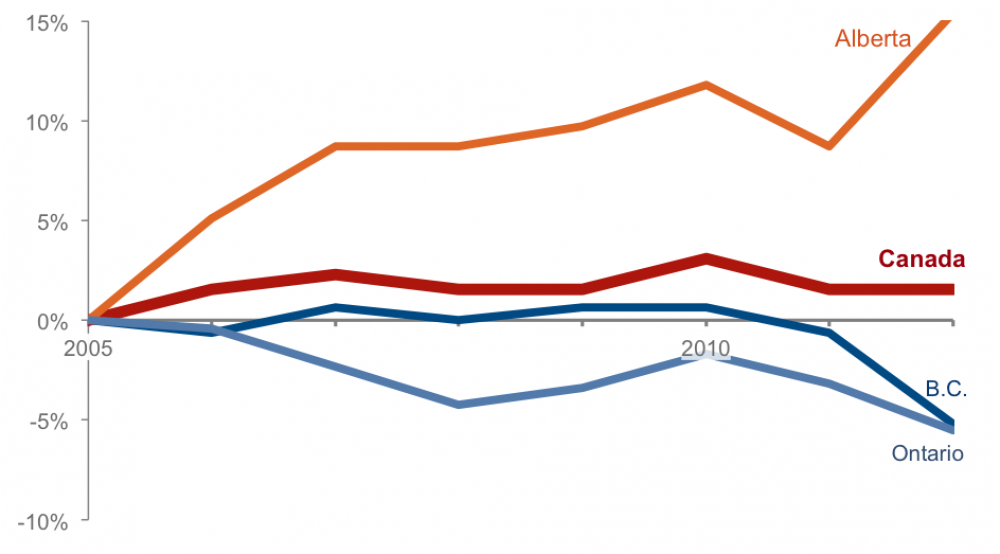
Changes in Canada’s GHG emissions from road transportation since 2005. Data from Environment Canada, National Inventory Report 2014.
Most provinces’ emissions are trending in the right direction — down — which is what we need to see to get on track for Canada’s target.
But there are exceptions, and they’re important ones.
Alberta now emits more carbon pollution than Ontario and Quebec — home to over 60 per cent of Canada’s population — put together. And more than 100 per cent of Alberta’s emissions growth since 2005 can be attributed to oilsands expansion.
Here’s how that math works: Alberta’s combined emissions from every sector other than the oilsands have fallen by four per cent since 2005. However, the 80 per cent increase in oilsands emissions from 2005 to 2012 means that the provincial total grew by seven per cent.
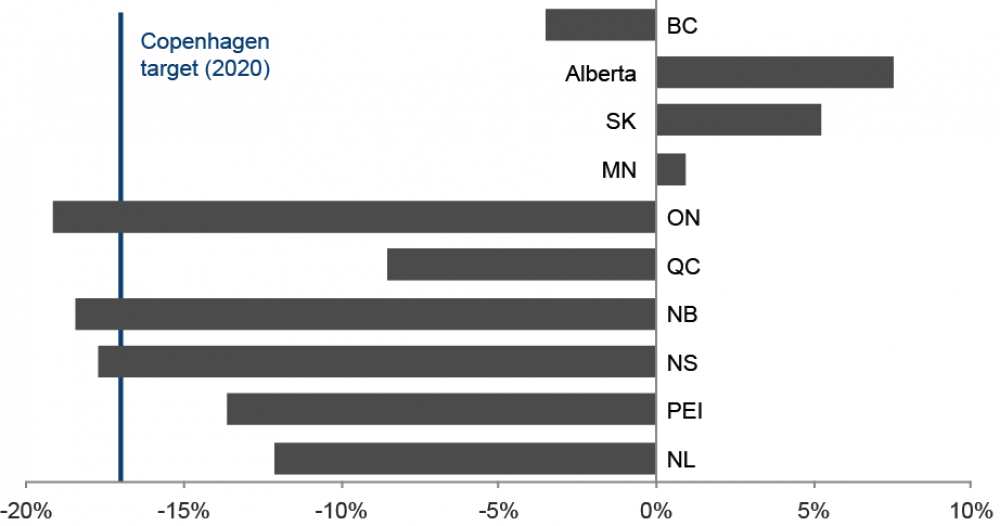
Changes in provincial GHG emissions since 2005. Data from Environment Canada, National Inventory Report 2014. Canada has committed to reduce GHG emissions to 17% below the 2005 level by 2020.
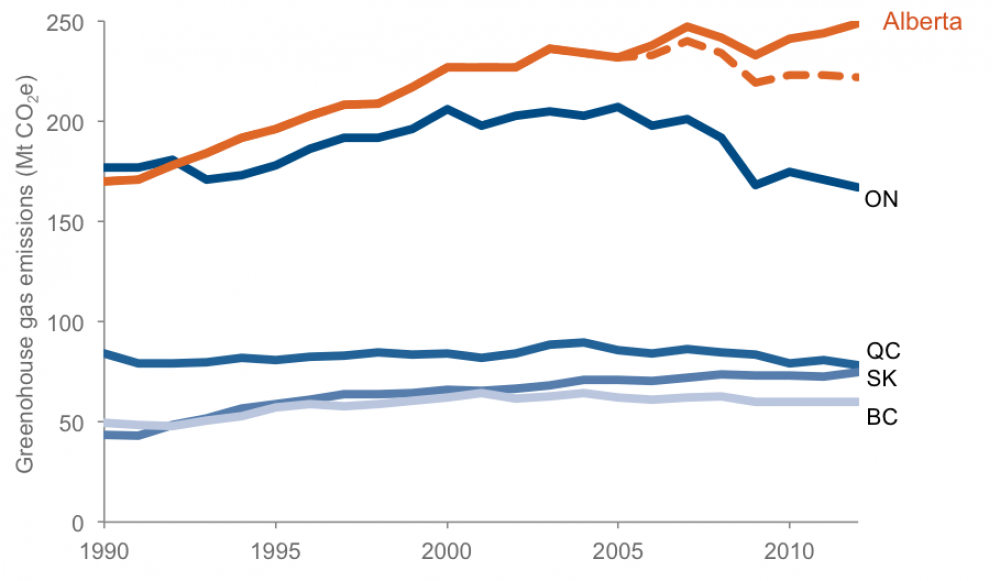
GHG emissions from Canada’s highest-emitting provinces. Data from Environment Canada, National Inventory Report 2014. The dashed orange line shows Alberta’s emissions with oilsands GHGs frozen at their 2005 level.
Story #3: Oilsands emissions are increasing and performance has stalled
In 2012, surging emissions from the oilsands pushed the oil and gas sector past transportation. It has become the highest-emitting sector in Canada, responsible for a quarter of national emissions.
The oilsands sector itself now accounts for nine per cent of all emissions in Canada — more than the entire province of British Columbia.
Last year, we flagged a significant concern that emissions performance in the oilsands had not improved since the mid-2000s. The flat trend continues, and this year, Environment Canada has made it official. “The emissions intensity [emissions per barrel] of oil sands operations declined steadily until about 2004,” they wrote. But “since 2004, the emissions intensity from oil sands operations has remained fairly static.” That means that as production grew by 80 per cent between 2005 and 2012, so did emissions.
With rapid production growth in the oilsands projected to continue, it’s absolutely critical for Canada to get the sector’s emissions performance back in gear. We explore this issue in more depth here.