Each spring, as the tulips are starting to bloom in Ottawa, Environment Canada releases its annual compendium of greenhouse gas (GHG) emissions data. It takes two years to compile and analyze all the data, so the report released yesterday covers emissions up to 2011.
The annual reports are required under the U.N. Framework Convention on Climate Change (UNFCCC) and provide a full account of Canada’s GHG emissions: what they are, where they come from and why they are changing over time.
Here are three stories that emerged from our first look at the report.
Story #1: Canada’s emissions continue to rise
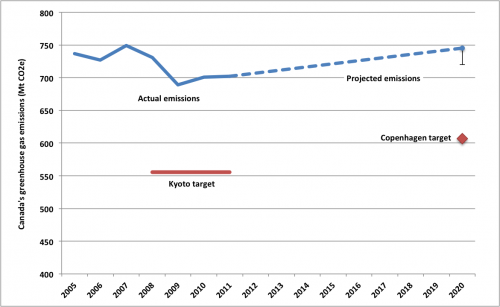
In 2011, Canada’s emissions rose to 702 million tonnes (Mt), moving further still away from our 2020 target of 607 Mt. Even worse, Environment Canada’s most recent projections show our emissions will continue to go in the wrong direction without much stronger policies.
Story #2: Some provincial policies are having a clear impact
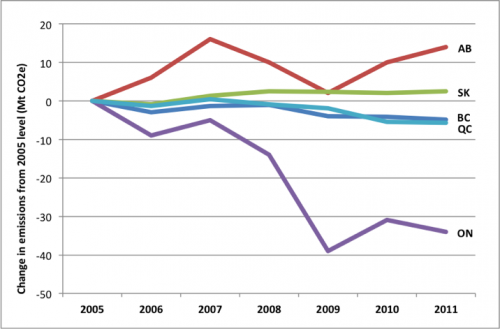
Since 2005 — the year the federal government has chosen to measure its progress against — emissions from electricity generation have fallen by 30 Mt, with Ontario leading the way. The drop in emissions is due to the province’s phase-out of coal-fired power and its ramp-up of renewable energy and energy efficiency. In total, Ontario has cut emissions from its electricity sector by 19 Mt, or 57 per cent, while generating an almost identical amount of power. (In other words, the emissions per unit of electricity generated also fell by more than half).
Other provinces with significant climate policies in place, like Québec, B.C. and Nova Scotia, are also seeing the beginning of a gradual decline in their emissions. More work is needed to build on these successes but they are encouraging nonetheless.
Story #3: Oilsands emissions performance stuck in neutral
After a dip during the recession, Alberta’s emissions are on the rise again, with oilsands emissions having grown by 62 per cent since 2005. The sector now accounts for eight per cent of Canada’s total — the same amount as the emissions from all the coal power in Alberta and Saskatchewan combined.
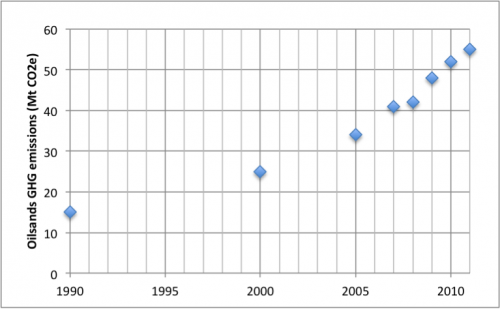
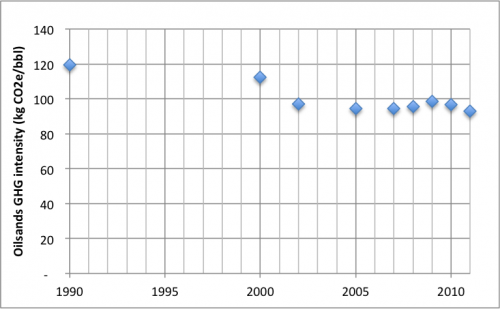
While Alberta has a policy that requires large polluters to reduce their emissions intensity (emissions per unit of production) by up to 12 per cent or pay into a technology fund, it’s clear this policy is not yet strong enough to reduce emissions intensity in the oilsands. Emissions per barrel have been essentially flat since 2005, meaning that rapid production growth has led to equally rapid emissions growth.
Strong policy signals are needed to drive improvements in emissions performance and enable Alberta to contribute a fair share of the reductions needed to meet Canada’s target. Otherwise, the oilsands will continue to struggle with social license and market access barriers related to their high carbon intensity and Canada's continued failure to meet its emissions targets.


