If you’ve been following the Canadian government’s sales pitch for the Keystone XL pipeline, you’ve probably heard this claim before: “Emissions per barrel have been reduced by 26 per cent between 1990 and 2011.”
(If you live in Washington, D.C., you may have even seen it on subway ads!)
Proponents of oilsands expansion repeat this point at every opportunity, hoping to defuse concerns that expanding oilsands production will significantly increase Canada’s greenhouse gas (GHG) emissions. The message implies that things are getting better all the time.
Given the scale of oilsands expansion planned for the coming decades, it’s worth venturing past the talking point to better understand these emissions intensity improvements and whether or not they will continue.
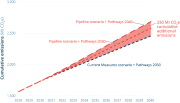
The oilsands sector already emits as much carbon pollution as the entire province of British Columbia, and production is projected to double within a decade. Trends in the sector’s GHG performance will therefore have a huge impact on emission levels and major consequences for Canada.
A closer look at the 26 per cent improvement
Since 1990, oilsands production has quintupled, while GHG emissions from production and upgrading have quadrupled. Figure 1 shows the close relationship between annual GHG emissions and the rate of production — especially in recent years.
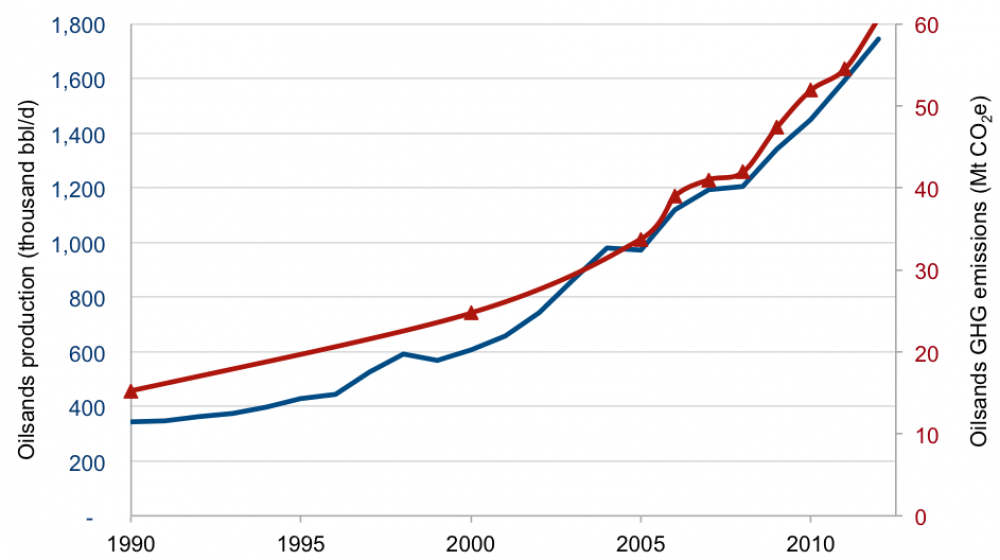
Figure 1: Oilsands production and GHG emissions. Production data (synthetic crude oil and bitumen) from CAPP Statistical Handbook 2013, Table 03-02A. Emissions data from Environment Canada, National Inventory Report 2014 and Canada's Emissions Trends 2013.
Since emissions grew less rapidly than production, emissions per barrel have indeed fallen. But this improvement took place almost entirely in the early years. In fact, since 2005, emissions and production have been marching in lockstep, with emissions and production both growing by 80 per cent.
Figure 2 shows the improvement and plateauing of the oilsands sector’s average GHG intensity. It uses production data from the Canadian Association of Petroleum Producers and Statistics Canada, as well as values reported directly by Environment Canada.
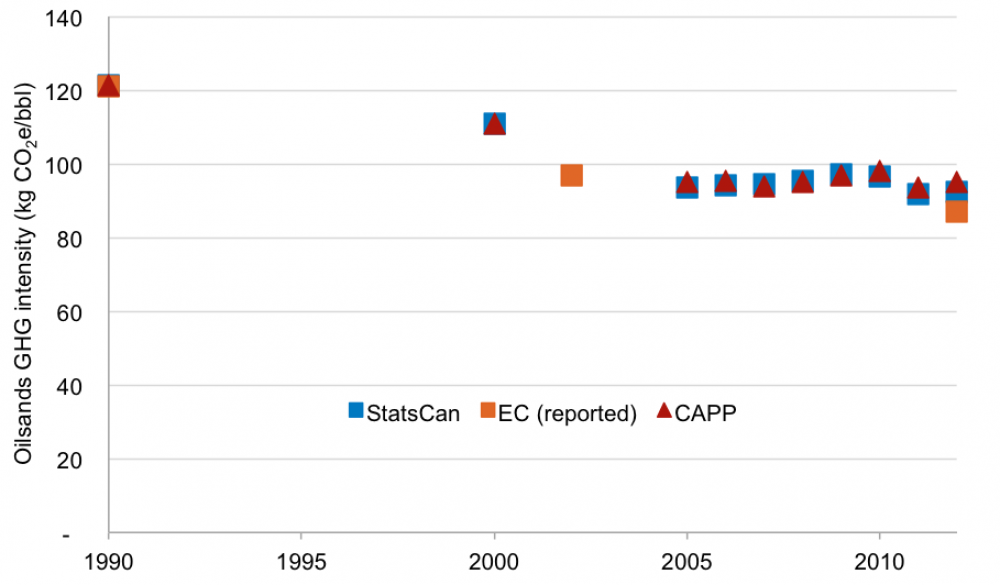
Figure 2: Aggregate oilsands GHG intensity, 1990-2012. Shows total oilsands emissions (production and upgrading) over produced barrels (SCO and non-upgraded bitumen). Production data from CAPP Statistical Handbook 2013, Table 03-02A and Statistics Canada, CANSIM Table 126-0001. Emissions data from Environment Canada, National Inventory Report 2014 and Canada's Emissions Trends 2013.
Again, we can see that any notable improvements in GHG performance happened before 2005. Since then, the industry has not made significant gains in reducing per-barrel emissions. Despite year-to-year variation, the average trend since 2005 shows little to no overall improvement, as can be seen in Figure 3. 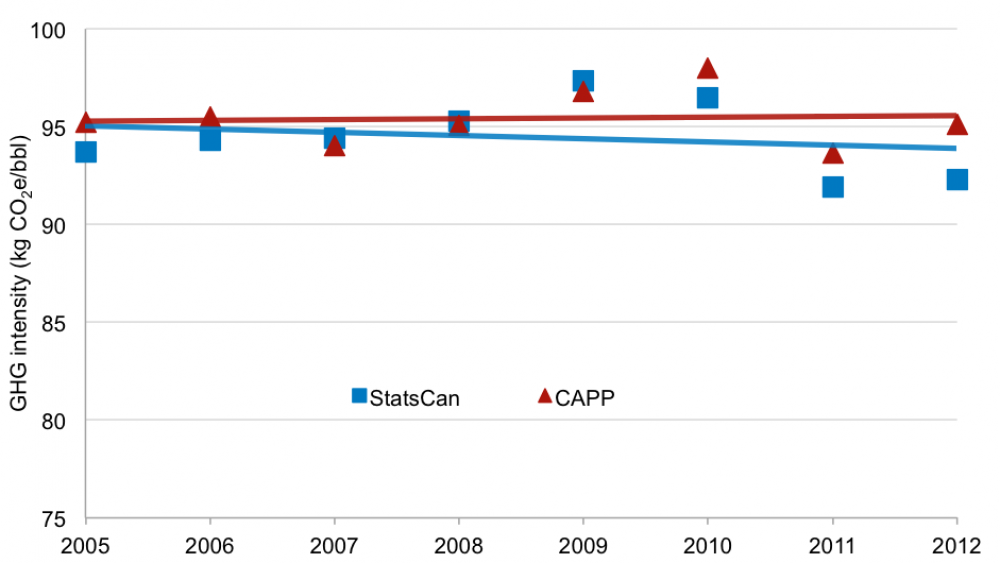
Figure 3: Aggregate oilsands GHG intensity, 2005-2012. Shows total oilsands emissions (production and upgrading) over produced barrels (SCO and non-upgraded bitumen). Production data from CAPP Statistical Handbook 2013, Table 03-02A and Statistics Canada, CANSIM Table 126-0001. Emissions data from Environment Canada, National Inventory Report 2014 and Canada's Emissions Trends 2013.
In other words, the claim that overall emissions per barrel have fallen 26 per cent since 1990 is more or less true — but it’s also a red herring. Stéphane Dion could have made essentially the same claim when he was environment minister back in 2005.
Exploring the plateau
By understanding what has driven trends in oilsands emissions performance, we can also shed light on what to expect in the future.
Two sets of factors have been pulling intensity in opposite directions, like rival teams in a tug of war. As Environment Canada explains, technological and operational improvements have led to greater energy efficiency in the oilsands, particularly at in situ facilities. Some companies have also pursued one-time opportunities to cut emissions, such as switching fuels from coke to natural gas to power their facilities.
However, in situ extraction is growing much more rapidly than mining. Because in situ production is significantly more GHG-intensive than mining, enlarging its share of production has increased the sector’s overall emissions intensity. And despite efficiency improvements at mining facilities, their intensity has trended slightly upward over time as well. This happens because operators need to use more energy to reach deeper or more distant resources, or process a larger volume of lower-quality ore to deliver the same quantity of product.
Early on, the factors that reduce emissions were winning the tug of war and emissions intensity improved. But since 2005 or so, the opposing sides have largely balanced each other out, leading to a plateau in GHG performance. As Environment Canada reports, “since 2004, the emissions intensity from oil sands operations has remained fairly static.”
This includes upgrading — the process operators use to break the bitumen down into partially refined, higher-value products. In the early 2000s, many operators made improvements to their upgrading operations. Upgrading intensity fell by a third, which contributed to the 26 per cent improvement in the oilsands sector’s overall emissions intensity.
When we decouple upgrading emissions from extraction emissions, as in Figures 4 and 5, we can how the GHG intensity of bitumen extraction itself has changed.
According to Environment Canada, GHG emissions per barrel of raw bitumen recovered from mining were 12 per cent higher in 2011 than in 1990. In situ extraction improved by 23 per cent between 1990 and 2011, but started from a much higher baseline and remains significantly more emissions-intensive than mining.
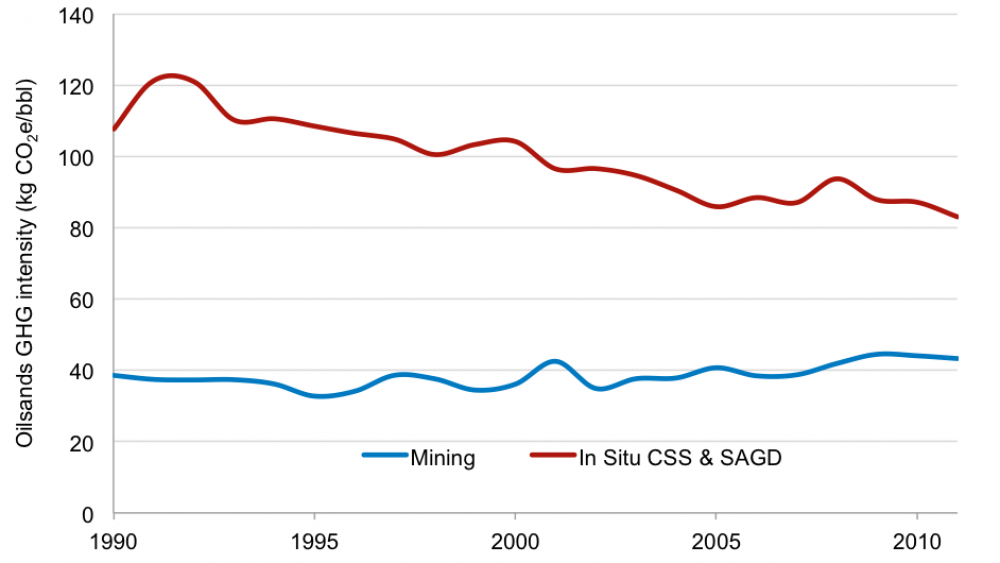
Figure 4: Historical Mining and In Situ Bitumen Extraction Emissions intensities. Adapted from Environment Canada, Canada's Emissions Trends 2013, Figure 4.Note:Environment Canada annual GHG intensities for CSS and SAGD have been combined as a production-weighted average using production data from Alberta Energy Regulator, ST-98.
As in situ production accounted for a growing share of the sector’s overall production, the overall emissions intensity of bitumen extraction has risen. That trend is already visible in Figure 5, below, and is projected to continue. In 2012, extraction-related emissions intensity was seven per cent higher than in 1990.
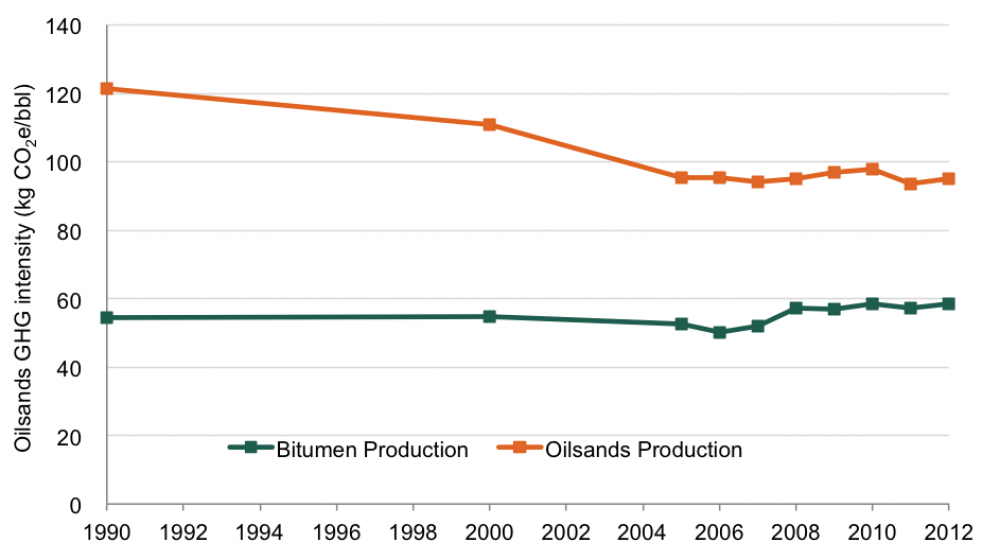
Figure 5: GHG intensity of raw bitumen and oilsands production. Crude bitumen production data from AER, ST-98; oilsands production (SCO and non-upgraded bitumen) from CAPP Statistical Handbook 2013, Table 03-02A. Emissions data from Environment Canada, National Inventory Report 2014 and Canada's Emissions Trends 2013.
Environment Canada’s most recent projections assume that the current sector-wide intensity plateau will continue. In other words, the government is making a responsibly conservative forecast that, under current policy conditions, emissions performance in the oilsands will not improve significantly. Small gains in efficiency will continue to be offset by the shift towards more emissions-intensive in situ production and declining reservoir quality that are driving extraction intensity upwards. At the same time, the proportion of bitumen that is upgraded in Canada is projected to fall, leading domestic upgrading emissions to grow more slowly.
On this basis, Environment Canada’s production and emissions projections suggest that the oilsands sector’s overall emissions intensity will fall by only one per cent between 2010 and 2030. Meanwhile, the GHG intensity of the bitumen extraction process itself is projected to rise by 17 per cent.
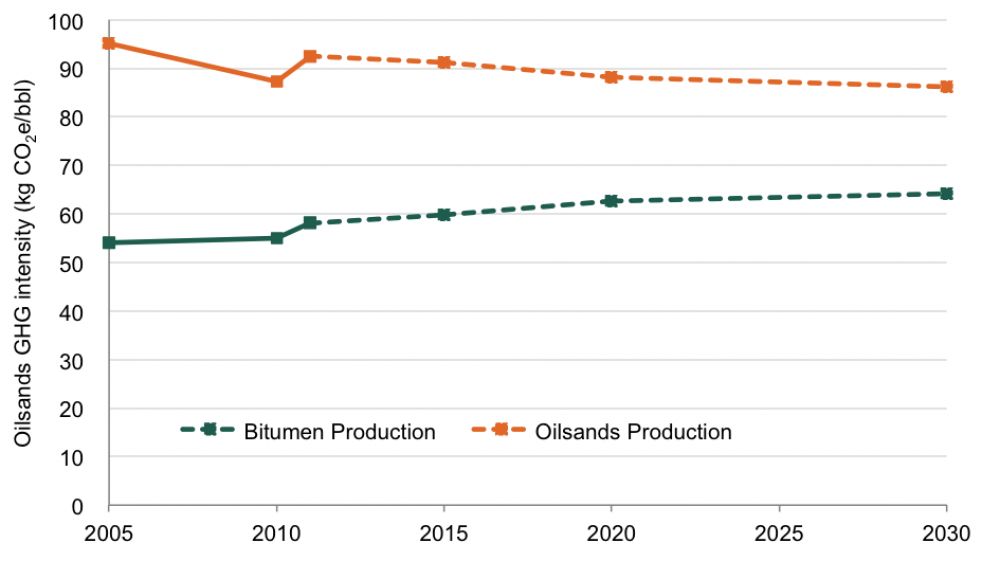
Figure 6: Projected GHG intensity of raw bitumen and oilsands production. Production and emissions data from Environment Canada, Canada’s Sixth National Report on Climate Change, Tables 5.7, 5.8 and 5A.4.
However, oilsands emission performance doesn’t have to stay stuck in neutral. I’ll outline some solutions in my next blog post.