
In February, Environment Canada presented a series of images related to air quality in Alberta at the Oil Sands Monitoring Symposium. The Alberta Environmental Monitoring, Evaluation and Reporting Agency, which hosted the symposium, recently posted the full suite of images, including videos, online.
A picture is worth a thousand words, and that’s certainly true in this case. Many of the images show air emissions modelling results across the entire province — something that can be hard to grasp otherwise. In particular, these images show the dispersion and deposition of sulphur dioxide (SO2) and nitrogen oxide (NOx) emissions, which are of particular concern to the public for health reasons.
This kind of visual modelling hasn’t been available to the public in the past, and it’s getting some attention from the media. These images deserve to be viewed and understood, so we’ve posted them here along with labels and explanations. The centrepiece is this video, showing how SO2 is emitted and dispersed across western Canada:
Air quality is a hot topic
SO2 and NOx emissions impact human health not only because they can cause direct harm, but also because they can react in the atmosphere to create fine particulate matter (PM2.5). The Alberta government has found that NOx and SO2 are the main causes of past incidents where PM2.5 concentrations have exceeded Canada’s air quality standards.
PM2.5 can cause asthma attacks, hospitalizations and even premature death, as we’ve summarized before. It’s a particular concern in Alberta, where PM2.5 is putting us on track to have the worst air quality in Canada, and Edmonton’s pollution levels are exceeding Toronto's.
These images underscore the cumulative impacts of a small number of very large industrial emissions sources — particularly coal plants, the oilsands and refineries — in addition to distributed industrial activities such as oil and gas operations. Those may all be separate sources, but their emissions end up in the same air. Pollutants from these different sources mix together in the air Albertans breathe, resulting in increased risks to human health.
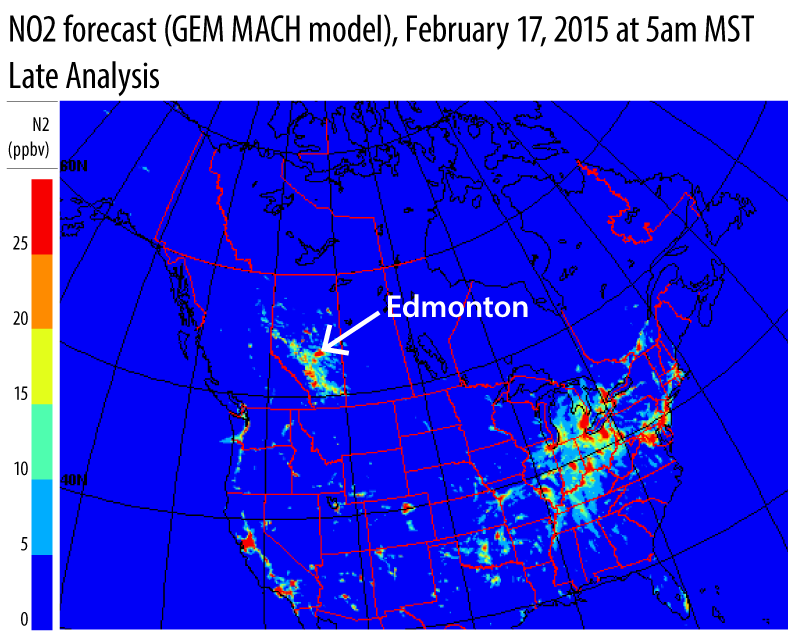
NOx lights up Alberta
The image below shows NOX levels in ambient air in Alberta. The scale runs from blue (for the lowest concentrations) through yellow, and then to red (for the highest concentrations). Alberta is unique in the western half of North America for its mid- and high-level readings. The province more closely resembles the densely populated mid-Atlantic region of the United States, or the coal-burning Midwest, than our western neighbours.
Problem spots near coal plants, refineries and the oilsands
Another image shows how SO2 and NOX that is released into the atmosphere returns to ground level, or “deposits.” The image reveals a clear concentration (the orange and red spots) of the two pollutants being deposited around both Edmonton and the oilsands in northeast Alberta.
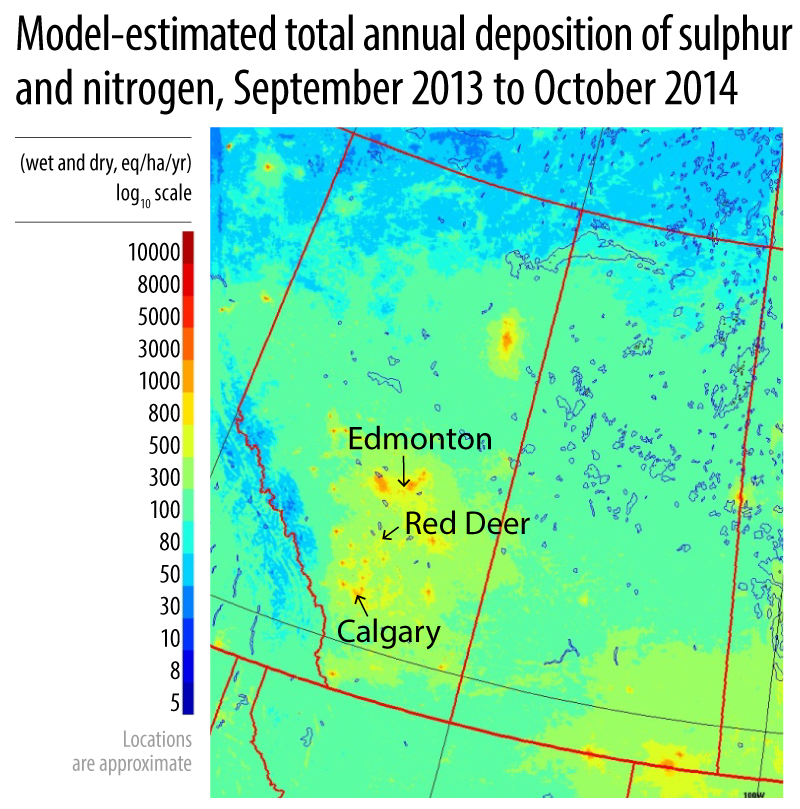
Edmonton is sandwiched between three large coal-burning power plants, which are clustered near Wabamun Lake west of Edmonton, and refineries on the east side of the city.
Air pollution on the move
The video that AEMERA posted shows modelled SO2 plumes from large emitters across British Columbia, Alberta and Saskatchewan. The three-dimensional plumes reflect SO2 concentrations of at least three parts per billion. How the plumes travel was modelled using real weather conditions from a four-week period in the fall of 2013.
The video visually represents where SO2 is generated, how it moves through the atmosphere and where it eventually lands. As SO2 deposits on the ground, the land surface in the video changes colour to indicate where higher depositions are modelled. Although the specifics will differ for other pollutants, the video is representative of how airborne pollutants generally are dispersed and deposited.
It’s not particularly surprising to see that SO2 pollution originates from oil and gas production, coal plants and the oilsands — Alberta’s three largest-emitting sectors, by far. But seeing how much of the province is affected by these plumes may come as a shock.
The video shows that major industrial emissions do not blow in the direction of the prevailing wind pattern. Rather, they shift directions and can be combined with pollutants emitted in different areas. This raises concerns about environmental evaluations for new industrial emitters, since those evaluations focus on a much smaller area around the polluter — and focus on prevailing winds — rather than these dynamic wind patterns.
The data used for the oilsands is from 2010, so it discounts the emissions growth in that region over the last five years. The data for the rest of the sources is from 2006. In terms of coal emissions, these images correspond closely to today’s reality: NOx and SO2 in 2014 are at nearly the same levels as in 2006.
Better data enables better decisions
The new provincial monitoring agency, AEMERA, is living up to its mandate by disclosing this data from Environment Canada. This type of information is crucial for understanding how the impacts of air pollution sources add up. That, in turn, allows for better policy decisions to protect Albertans’ health — be it deciding what new industrial projects should be approved, or weighing the benefits of replacing coal plants with cleaner alternatives.
Joe Vipond is an emergency room physician and member of the Canadian Association of Physicians for the Environment.