Photo: Pembina Institute
Emissions data released in the 2021 National Inventory Report show that Canada’s greenhouse gas emissions in 2019 were just 1 per cent lower than they were in 2005, the baseline year against which our climate efforts are measured under the Paris Agreement. Years of insufficient action are evident. This year, as nations ratchet up ambition to align with what science requires in advance of COP26, it’s imperative that Canada generate the momentum to escape a perpetual plateau in carbon pollution. Clearly, much more needs to be done.
Prior to the 2016 Pan-Canadian Framework, Canada’s first ever national climate plan, emissions in 2019 were forecasted to reach 764 million tonnes (megatonnes), which is 34 megatonnes (or about 5 per cent) beyond where the actual empirical data have landed (730 Mt in 2019). That’s the good news: the emissions curve is bending down. But the reduction rate has not yet reached a velocity that would actually achieve Canada’s climate targets.
Meanwhile, from a policy perspective, much has changed since the Paris Agreement was signed. There is a credible case to be made that we are light-years ahead of where we were in 2015, and that the rate of change is about to increase.
Important measures, from carbon pricing to methane regulations to standards for cleaner fuel, are finally settling into place across Canada — though they have not been around long enough to show up definitively in our emissions data.
An analysis conducted by Environment and Climate Change Canada supports Minister Jonathan Wilkinson’s recent claim that 2019 would be the last year Canadian greenhouse gases go up. That analysis says: “Early modelling for 2020 shows that, as a result of the policies under the Pan-Canadian Framework and the Strengthened Climate Plan, absolute emissions in Canada are projected to decrease annually starting in 2020, reaching an output of 503 megatonnes by 2030.”
In sum, emissions in 2030 are now forecasted to be 227 megatonnes lower than they were before the PCF was drafted, with the new climate-change plan contributing a minimum of 85 megatonnes of additional reductions. Together, the full implementation of these current policy packages would help Canada realize emission reductions of 31 per cent below 2005 levels.
That means there’s good reason for optimism about the potential for meeting the current 2030 challenge, as long as current policies are not watered down.
Canada is expected to raise its climate ambitions
In fact, policies need to get stronger. Canada — along with other nations — is expected to set a new 2030 target in alignment with the call for more rigorous targets to safely limit warming to 1.5 degrees Celsius. Unfortunately, we’ve left it till late in the game to achieve even deeper cuts to emissions.
Every half-decade, parties to the Paris Agreement are expected to table goals and plans to exceed their current level of ambition. The first round of this “ratchet mechanism” was supposed to kick in last year, but the coronavirus pandemic caused many countries, including Canada, to delay plans to enhance their reduction commitments.
Modelling done for Canada’s tougher federal climate plan suggests that, with additional provincial and private-sector support, Canada has a reasonable shot at achieving reductions of 32 to 40 per cent below baseline 2005 levels.
Canada is now saying it will announce a new target on or before U.S. President Joe Biden’s Leaders Summit on Climate, which will coincide with Earth Day on April 22. Many expect the Biden Administration will announce a 50 per cent by 2030 target, in alignment with a science-based carbon budget, to help safely limit warming to 1.5 degrees Celsius. Pressure will be on Canada to do the same, so as to align with our biggest trading partner on pathways to net-zero emissions by 2050. The current government has long expressed an intent to “meet or exceed” the 2030 target it (voluntarily) inherited from its predecessor. Will it now meet the same standard regarding the climate agenda of its major economic partner?
What do the National Inventory Report data show?
Here are some of the most important findings:
- Canada is still responsible for 1.5 per cent of global greenhouse gas outputs. Despite marginal reductions in per capita emissions since 2005, we are still among the highest per capita emitters in the world, at 19.4 tonnes of carbon dioxide emissions per capita in 2019.
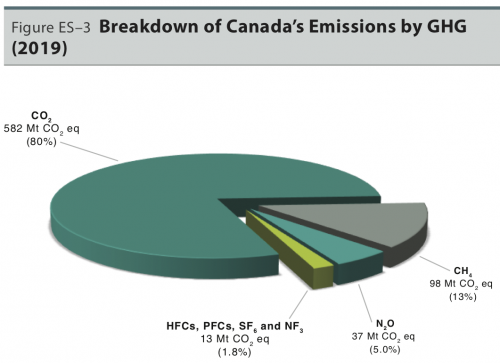
- 81 per cent of total greenhouse gas emissions are from the energy sector (stationary combustion, transport, and fugitive sources). Of the different greenhouse gases, carbon dioxide is the largest contributor (80 per cent of total emissions), and “the majority of [these] emissions in Canada result from the combustion of fossil fuels.”
- Methane (CH4) emissions in 2019 amounted to 98 megatonnes, or 13 per cent, of Canada’s total, mostly in the form of fugitive emissions from oil and natural gas systems, agriculture, and landfills. (For next year’s national inventory, ECCC is also promising significant new modelling improvements to NIR estimates of methane emissions. In particular, they tease a new fugitive emissions model to accurately gauge emissions from pneumatic devices, compressor seals and equipment leaks in the upstream oil and gas industry. These are welcome changes given methane’s significantly higher global warming impact and its substantial role in Canada’s current inventory. Continuous refinement of our understanding of methane emissions will be important as the federal government works with oil-and-gas-producing provinces to achieve 2025 methane reduction targets — 40-45 per cent below 2012 levels — and to join the United States in setting even more aggressive targets. Ultimately, Canada should be aiming for direct measurement of methane, so it can move beyond the uncertainty associated with current estimation methods — which recent research suggests substantially undercount the true level of emissions.)
- Nitrous oxides (5 per cent) and synthetic gases (HFCs, PFCs, SF6, NF3) account for the remainder of emissions.
-
There is ongoing evidence for a “decoupling” of emissions and economic growth. The greenhouse gas intensity of the economy (GHGs per GDP) has declined by 37 per cent since 1990 and by 23 per cent since 2005. This is largely due to fuel switching, efficiency gains, modernization of industrial processes, and structural changes in the economy.
Where are the emissions coming from?
By sector
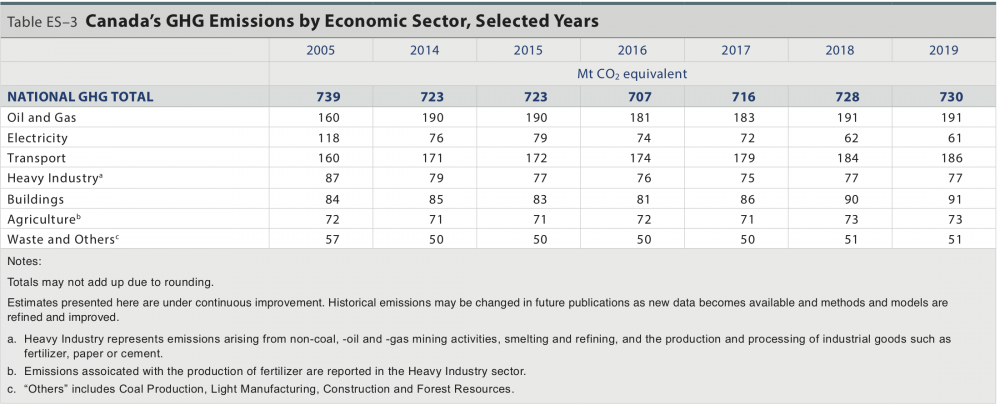
Greenhouse gas trends since 2005 have remained steady. Increases in the oil and gas (up by 31 megatonnes or 20 per cent) and transport (up by 26 megatonnes or 16 per cent) sectors have been mostly offset by decreases in other sectors, especially electricity (down 57 megatonnes or 48 per cent) and heavy industry (down 10 megatonnes or 11 per cent).
Canada’s overall emissions growth during this period has been driven primarily by oil and gas extraction, and an increase in the number of light-duty gasoline trucks and heavy-duty diesel vehicles on the road. Other significant increases have come from the production and consumption of industrial/synthetic gases and the application of nitrogen fertilizer in agriculture.
By province and territory
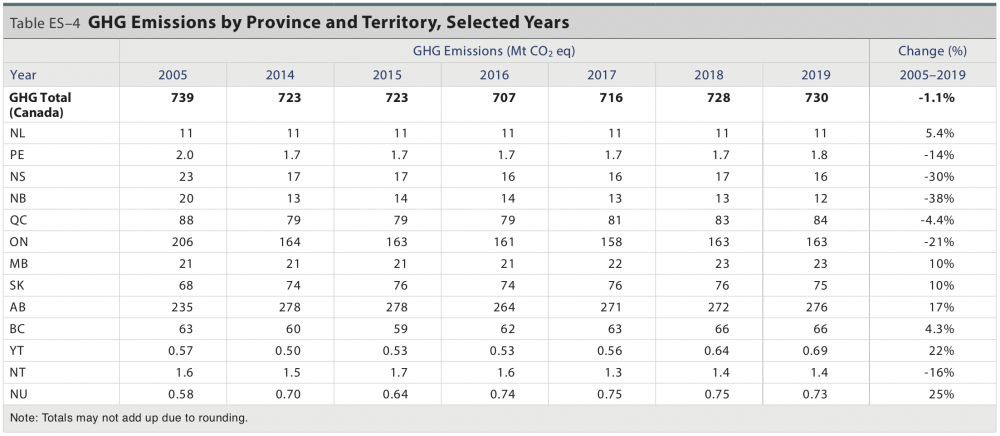
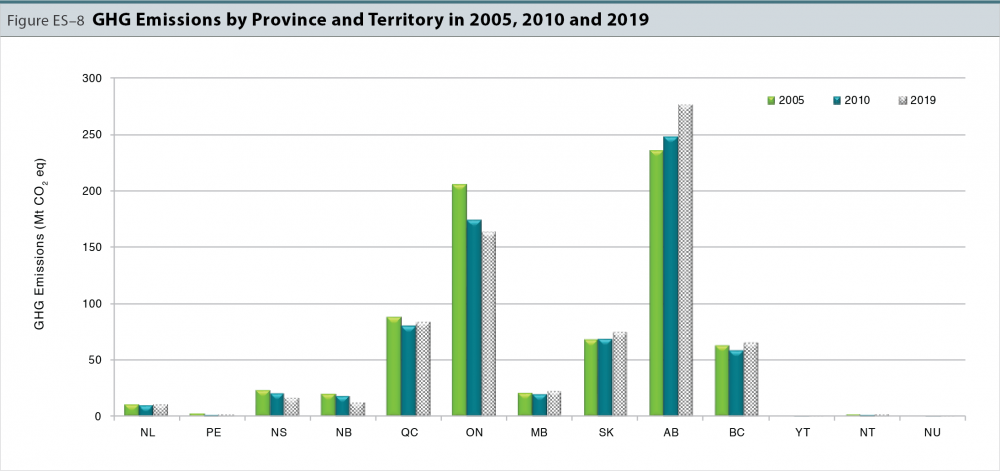
The top-emitting provinces, Alberta and Ontario, continued their divergent trends. Between 2005 and 2019, Alberta’s emissions rose 17 per cent while Ontario’s declined by 21 per cent. However, most of Ontario’s progress in reductions was achieved prior to 2014 (the year marking the completion of its phase-out of coal-fired power in the electricity sector). Saskatchewan saw an increase of 10 per cent between 2005 and 2019, as did its neighbour Manitoba. British Columbia’s emissions rose 4.3 per cent.
In the East, Quebec, which is the third-highest emitting province, saw emissions decline by 4.4 per cent. And on the East Coast, the news is mostly encouraging: Emissions fell by 38 per cent in New Brunswick, 30 per cent in Nova Scotia, and 14 per cent in Prince Edward Island. Among the easterners, only Newfoundland and Labrador saw emissions climb, by 5.4 per cent since 2005.
In summary (since 2005):
- Emissions up: British Columbia, Aberta, Saskatchewan, Manitoba, Newfoundland and Labrador, Yukon, Nunavut
- Emissions down: Ontario, Quebec, New Brunswick, Nova Scotia, Prince Edward Island, Northwest Territories
Heightened ambitions require stronger policies
While the prospect of hitting our 2030 target seems a little more likely these days, with a steeper target soon to be adopted, policies will need strengthening if we’re to hope for good news in the future data.
Bora Plumptre was a senior analyst for the Pembina Institute’s federal policy program until 2022.


