Last year, the Pembina Institute and the Royal Bank of Canada surveyed residents of the Greater Toronto Area and found that 81 per cent would prefer to live in a location-efficient neighbourhood that is walkable, transit-accessible, mixed-use and closer to work, even if that means giving up a large detached house and yard in the suburbs.
It’s worth noting that this survey was conducted in 2012 and again in 2014, producing consistent results in both years.
Not surprisingly, the survey also revealed that the typical homebuyer does not — or cannot — put their money where their mouth is. Over 80 per cent chose a home location based on what was affordable, rather than their preferred location. They were “priced out” of location-efficient neighbourhoods, be it leafy downtown Toronto communities or liveable suburban hubs — a phenomenon Pembina has examined in detail.
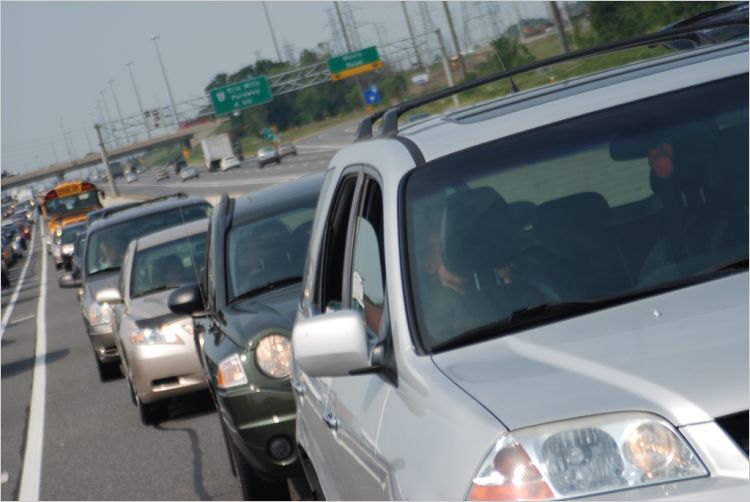
Of course, this is not endemic to Toronto. It is the trend in most North American cities: homebuyers often “drive until they qualify” for a mortgage, moving to far-flung suburbs in pursuit of a detached home with a low sticker price. Yet that homebuying dream can turn into a nightmare of long commutes and costly transportation bills.
Doing the math
Pembina wanted to find out what happens when the costs of a home’s location are visible along with the “sticker price” at the beginning of a homebuyer’s decision-making process, rather than being discovered later.
Our latest report, Location Matters, does that by looking at home options through the eyes of four homebuyers, each of them with different budgets, needs and family sizes. There is also an interactive website that explores the research findings.
We provided each homebuyer with home options in different locations. Some were in car-dependent areas with larger and lower-priced homes, while others were more location-efficient: semi-detached houses, townhouses and mid-rise units with access to rapid transit. The location-efficient options often created the opportunity to get rid of one car in a household, and thus save a minimum of $200,000 over the lifetime of a mortgage.
We did our best to find home options that met the homebuyers’ needs: number of bedrooms, bathrooms, having a finished basement and so on. We then calculated the monthly carrying costs of the home, which included the selling price, closing costs, land transfer taxes, property taxes and maintenance fees.
Next we factored in the transportation costs. Those included the full costs of car ownership or public transit use based on the distance each spouse would travel to work, as well as cost of lost time from commuting.
The results were stark but not surprising. A distant home with a cheaper sticker price can actually cost more when transportation costs are factored in.
In one case study, a homebuyer could choose between detached homes in either the distant suburb of Milton or in Port Credit, a town east of Toronto connected to the city by commuter rail. Although the “sticker price” of the home in Milton was $180,000 cheaper than the Port Credit home, the full costs — including both housing and transportation — were actually $1,000 higher per month in Milton.
How to upsize on a limited budget
While every home and homebuyer is different, all of our case studies showed that owning a car is a major expense. The home options where a household only needed one car were significantly less expensive overall, while also providing shorter commute times. This was the case for Priya, a homebuyer who was looking to upsize on a limited budget, as well as Derek and his large family, who were hoping to find a home closer to downtown Toronto, where he and his wife work.
The graphs below (drawn from our report, which is also available in interactive form) present the housing and transportation costs for Priya and her spouse, as well as their combined commuting times. Note how adding in transportation costs significantly alters the affordability of some options, compared with only looking at housing costs.


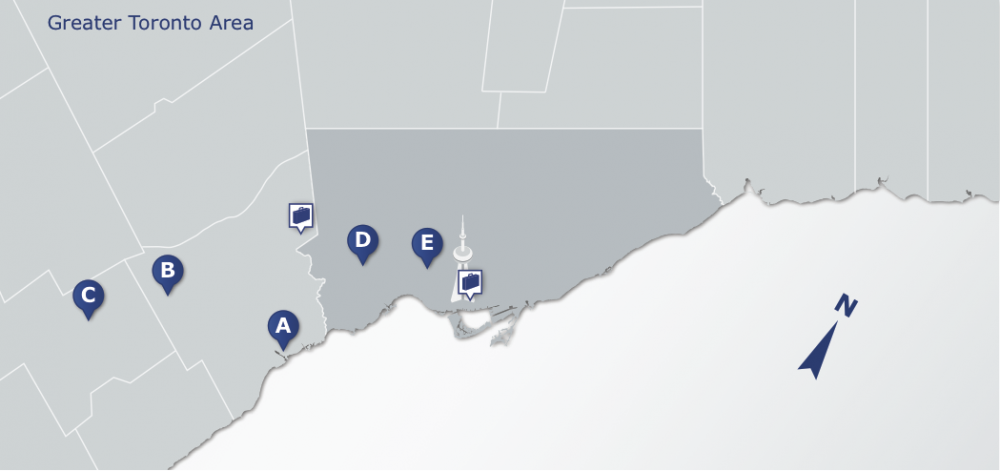
The map below shows the location of each home option with reference to where Priya and her spouse work (the briefcase icons). The homes are labelled “A” through “E” following the order in which they are presented in the graphs. The tower icon denotes downtown Toronto.
It’s not about downtown versus the suburbs
Location efficiency is not exclusive to downtown Toronto. Many suburban hubs have access to rapid transit and sidewalk cultures. In one of our case studies, a family could cut their transportation costs by more than $1,000 per month by choosing a home in the suburban city of Markham, where one of the spouse’s workplaces is located. Living in Markham allowed them to make use of rapid transit — both the commuter train and local bus rapid transit — and get rid of one car, while also walking to Markham’s historic village for shops and street life.
In fact, our report also included a “walkability and livability” index that we developed to compare properties at a more granular level than what Walkscore offers. We analyzed the quality and quantity of amenities, the proximity of rapid transit and the pedestrian-friendliness of each location. In the case of a tie between two home options for costs, the index helps homebuyers evaluate the quality of life that comes with a neighbourhood.
And the winner is…
The goal of our study was to calculate the full costs of home locations, and by the time our analysis was completed, the properties we examined had already been sold. Derek, one of the homebuyers in the case studies, is still looking for a home. In an interview with the Toronto Star, he said that commuting time will factor into his family’s decision.
More homebuyers need to be aware of location and transportation costs before they purchase a home. Ideally, this type of information will eventually be available to all homebuyers through a website or app, so they can make critical cost comparisons in real time — before they make a move.
This blog was originally published by Meeting of the Minds. It is based on the findings of our Location Matters report.

Cherise Burda was Ontario director at the Pembina Institute until 2015.